The signal interconnections between the readout racks on the top of T600 detector.
Author: Baibussinov Bagdat
Padova, 2002.
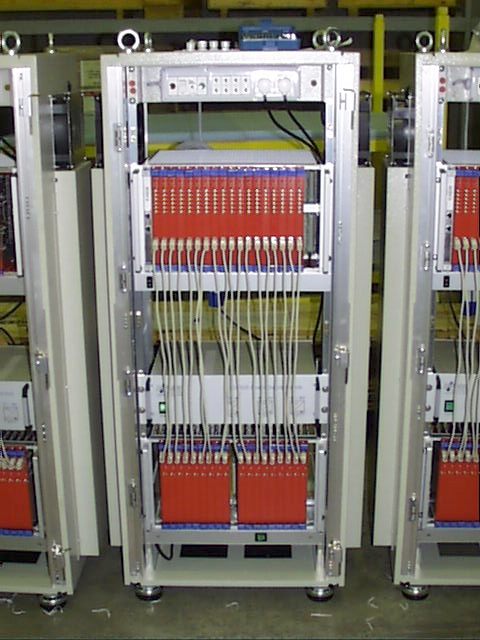
The last version of readout electronics is structured as four rows of rack on the top of detector. Each rack hosts all the readout channels needed to handle the set of wires connected though the corresponding feed-through. For T600 detector we have the rack with 576 channels on each (Fig 1). .
Figure 1. The readout rack of ICARUS detector
Each rack has:
One Analogue Crate:
- distribution and decoupling of the bias voltage to the wires (A764);
- test pulse distribution and setting of baselines (V793);
- accommodation 18 analogue boards providing amplification, shaping and analogue to digital conversion (V791C or Q).
One Digital Crate:
- 18 digital boards, where waveforms are buffered and processed to archive zero skipping (V789).
- Distribution of absolute clock and trigger signals (V816);
- 1 embedded CPU, controlling data collection and forwarding data to event builder (VME2100).
One linear power supplies for Analogue Crate.
One rack monitor, which monitors internal temperatures and ventilation flow, and allows remote control (through the I2C bus) of the power suppliers and line voltage.
The row of the racks has 18 normal racks and 4 modified racks. Two modified racks have just digital crates and another two have analogue crates with power suppliers.
To reduce the length of the cables each row of the rack and to divide them electrically one crate NIM for each row is used. Inside of the crate several Fan-Out modules are accommodated. Total number of crates NIM to distribute the common signal for ICARUS detector is four and they on the middle position of the rows are installed. Below you find common description of this system and some suggestion to avoid the common problem during installation of it.
The rack has connections with: - Power rack (line cable);
- Monitor PC (I2C and CAENet interfaces);
- Ethernet Switch (Ethernet cable);
- Crate NIM (Test pulse, Trigger, Global Clock, Enable signals).
Crate NIM.
The crate NIM use to distribute all commons signals to analogue e digital crates of one row of rack. This crate receive a few cables from trigger system and control room:
1. Trigger signal.
2. Enable
3. Reset.
4. Test pulse
and more number of cables have been distributing from crate NIM:
Number of Modules
from modules CCS-1-9 3
from module CC-1-6 1
c. 24-25 cables of the Global Clock 20 MHz. 1
from module FANOUT
d. 24-25 cables of the RESET CPU 1
from module FANOUT
e. 24-25 cables of the TRIGGER 1
from module FANOUT
Compact version of NIM crates with 10 slots is used. Crate NIM has 4 modules CCS-1-9, one module CC-1-6, 4 modules DUAL FANOUT (1-16) and the power supply too (Fig.2).
Total power of the crate:
Quantity Current Power+6 Volt -6 Volt
1. Module CCS-1-9 4 125 mA 125 mA < 5 W
2. Module CC-1-6 1 130 mA 160 mA < 5 W
3. Module FANOUT 1-16 4
Figure 2. The layout of the crate NIM.
Distribution of the test pulse.
There are four kinds of calibration that by V793 modules are provided:
(See the V793 specification).
Input of note
Calibration 1 V791C, Q test just V791
Calibration 2 A764 test A764, V793 together
Calibration 3 test point 1 begin of wires, used to test
connection of wires
Calibration 4 test point 2 on the end of wires, used to test
channel with cable and all boards.
The module CCS 1-9 receive signal from a pulse generator (Fig.3). Normally the module allows transmit any waveform signal and we can use a custom waveform generator. The choice of kind of signal depends from test conditions. To verify the coefficients of the channels and signal to noise ratio we can use step pulses for different calibration test.
All calibrations have different coefficients because of the noise and interference between different signals on the backplane of the analogue crate was found.
The table 1 shows all calibration coefficients from V793 to test points, which must be used during calculation of channels characteristic.
Table 1.
|
|
Gain V793 |
Gain V791 |
Gain A764 |
on the test capacitance(Count/fC) |
|
|
V791C |
2.3 |
0.1 |
|
Count/(0.23*Vin(mV))*1pF |
|
|
A764 |
2.3 |
|
2 |
Count/(4.6*Vin(mV))*1pF |
|
|
Test point1 |
2.3 |
|
0.1 |
Count/(0.23*Vin(mV))*1pF |
|
|
Test point 2 |
25/22=0.114 |
|
|
Count/(0.114*Vin(mV))*1pF |
|
Note. Attention please the signal on the input V793 is differential.
Obviously, the response of the amplifier with shaper will depends from waveform test signal. If you have the test pulse like step voltage with fast rise time we find one coefficient. And for triangle signal the coefficient will be different.
We calculate the gain of the analogue board for step signal 5+/-0.5 count/fC for V791C and 6.5+/- 0.5 counts/fC for V791Q boards.
Figure 3. The scheme of the distribution of the test pulses.
All Cables.
FROM TO
or Monitor Module Monitor Module
3. CAENet interface cable PC V793
or V793 V793
5. Trigger Signal FANOUT V816
6. Enable FANOUT V816
7. Calibration Pulse CCS-1-9 V793
8. Clock 40 MHz. CC-1-6 V793
9. Ground cable Flange Rack
10. High Voltage 1 Power Supply 1 HVfilter
11. High Voltage 2 Power Supply 2 Hvfilter
Inside of rack:
12. 18 signal cables Flange V764
13. 4 test signals Flange V793
14. 18 cables of link V791 V789
All boards:
Module: Function Number total
V789 Digital board. 18
V791 Analogue board. 18
V793 Slow control Module. 1
V764 Decoupling Board. 18
V816 Trigger Module. 1
Hvfilter Filter of High Voltage 1
Connection board 1
Specification of the signals.